Archive for August, 2012

Net metering update

Back in our June performance update, we mentioned that June was our first year anniversary for our solar PV system. In New York, the utility keeps track of the amount of power we use and generate (net-metering) over the course of a year and on the anniversary date credits the owner with any surplus power generated. We generated a surplus of 3,650 kWh from June 1, 2011 to June 1, 2012.

After several calls to customer service and waiting 75 days, we finally got our credit from the power company.

Are you sitting down? /joke/

$159.68

That works out to roughly $0.04 / kWh. That would be what the utility calls the ‘avoided rate’, the price they pay for not having to generate the electricity we sent back to the grid.

Oh well, at least it will pay for almost 10 months of “Delivery Service” fees in the coming year.

Now if New York could just get it’s act together and pass legislation creating a state-wide Solar Energy Renewable Credit (SREC) market. We generated over 8 megawatt hours in our first year of operation. SRECs in nearby Massachusetts are currently going for about $271 per megawatt hour. So 8 megawatt hours in Massachusetts would equal $2,168.

$2,168 sounds a lot better than $159.82 doesn’t it? It would also speed our payback period significantly and get a lot more people interested in solar.
Our water usage

Water usage to date

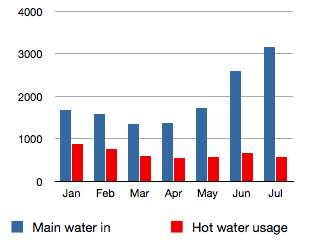
In our July performance post I stated that we were tracking our water usage and water pump usage to calculate the efficiency of the pump. Dan Gibson asked in a comment about our water usage, so I thought I’d cover that here. He says in his comment that there are not a lot of actual hard numbers on water usage and he’s definitely right. Most estimates I’ve seen online say 50 to 100 gallons per person, which seems both excessive and vague at the same time.

We installed water meters on the main line and the inlet to the hot water tank. We have usage data starting in January when we moved in.

All values in gallons Jan Feb Mar Apr May Jun Jul
Main water inlet 1,677.3 1,584.2 1,338.3 1,373.4 1,722.4 2,593.1 3,166.9
per day 54.1 54.6 43.2 45.8 55.6 86.4 102.2
Hot water inlet 884.5 746.6 600.8 552.5 569.7 660.8 567.4
per day 28.5 25.7 19.4 18.4 18.4 22.0 18.3

A couple of notes on the data. Our shower wasn’t ready for use until the middle of February which increased out water usage in the first few months. Showers are obviously more efficient than tubs. In May, we acquired 3 dairy goats, some chickens, started building a barn and watering the garden, pushing up our usage again.

Taking these factors into account, it looks like our typical average indoor water usage is about 45-50 gallons per day for 2 adults, or 23-25 gallons per person. Our hot water usage seems to average about 20 gallons per day. Hot water accounts for roughly 40% of our total indoor usage.

The larger number in July indicates the unfortunate situation where we turned on the water to the garden and forgot to turn it off. It ran for a few hours. Thankfully we use soaker hoses, otherwise the loss could have been much larger.

We had planned to use cistern water for the garden, but we ended up moving the garden to a different location that is about the same elevation as the cistern, meaning we can’t use gravity feed. We’re working on a low tech solution to pump the cistern water up above the garden to a separate tank which can than use gravity feed. For now, it seems just as efficient to use well water.

If you have any questions, let us know in the comments.

July performance

Heat map of high temps in July

We generated 970 kWh in July, up 3% from last month. That is our best month yet, but in line with last month’s daily average of 31.3 kWh. We used 319 kWh, 5% less per day on average than last month. We turned on the air conditioning for 3 days during a particularly humid run, and periodically for a few days the next week. We used 12 kWh for cooling / dehumidification, 8% of our month’s total usage. We generated a 651 kWh surplus this month, our 5th surplus month in a row and highest yet.

Jan1 Feb2 Mar6 Apr7 May Jun Jul
Solar PV production 369 597 860 925 867 939 970
Usage 873 666 515 378 309 325 319
Net usage or (surplus) 504 69 (345) (538) (558) (614) (651)
Avg. daily usage 28.2 23.0 16.6 12.9 10.0 10.8 10.3
HDD3,4 1,2125 1,045 704 617 298 144 34
All values in kWh (except HDD).
1 January values based on meter reads.
2 February values based on TED data.
3 Heating Degree Days, a measure of how many outside degrees in a day it is below a base target inside temperature, 68F.
4 Calculated from our HOBO outdoor weather monitor hourly data, unless otherwise noted.
5 January HDD data downloaded from degreedays.net, Station ID: KALB (Albany International Airport).
6 March values based on meter reads. (TED died March 1st, eMonitor installed March 16, 2012)
7 Values starting in April are based on eMonitor data.

I also did some number crunching this month to start tracking the efficiency of our water pump over time. We track the water pump electrical usage and the number of gallons of cold and hot water we use each month. We’re currently using 2.6-2.7 watt hours per gallon of water pumped from the well. That’s roughly 374 gallons per kWh. I’m curious if that is a good number or not? I’ll have to do some research.

The image at the top of the post shows a heat map of the high temps of the month. The average temperature in July was 73.6F, up 7F from June. You can see heat maps and detailed charts of temperature and electrical usage at netplusdesign.com. View solar, usage, net usage, temperatures and HDD for all of February and circuit-level data for 16 days in March and the full months of April through July.


Enter your email address to subscribe to this blog and receive notifications of new posts by email.

Join 305 other subscribers