Archive for the 'Plumbing' Category

October performance

Total usage vs production in kWh as of Oct 31

October was overshadowed by the events of the last week. Despite the best efforts of Hurricane Sandy we are safe and dry at Up Hill House. We had plenty of strong wind gusts, but not nearly as bad as the costal regions. We were prepared for the worst. We stocked up on water and easy to prepare meals. We have a small propane burner that can be used to heat water or simple cooking. We packed the chest freezer with ice. We filled the bathtub for flushing and the cistern was full for the farm critters. Thankfully the power never went out.

October was considerably more cloudy. We only generated 511 kWh, down 73% from September, but still about 43 kWh better than predicted.

We used 433 kWh, our highest month since March. That’s up 48% from the previous month. We turned on the heating for a 27 hour stretch starting on October 3rd at 3pm, although I can’t remember why. It wasn’t particularly cold inside or out. We used a total of 6.3 kWh for those 27 hours. That only accounts for 1.5% of our month’s total usage. The big increase was due to washing dishes, cloths and cooking (256 kWh versus 164 kWh the previous month). I like to refer to this as the mother-in-law effect. Unfortunately we were not able to use the clothes line this month due to lady bug beetle swarms.

Despite the lower solar generation and the higher usage, we still managed to squeak out a 78 kWh surplus this month, our 8th surplus month in a row, and likely our last for the year. We’re still on track to produce more than we use in our first year.

The number of hours we experienced temperature values below 68F increased to 446 HDD, slightly milder than average for October in our area. Our water usage increased this month, due to extra wash loads and additional water we stored in case we lost power during Sandy. We averaged 65.6 gallons per day.

Month Solar PV Usage Net usage or (surplus) Avg. daily usage HDD3,4
Jan1 369 873 504 28.2 1,2125
Feb2 597 666 69 23.0 1,045
Mar6 860 515 (345) 16.6 704
Apr7 925 378 (538) 12.9 617
May 867 309 (558) 10.0 298
Jun 939 325 (614) 10.8 144
Jul 970 319 (651) 10.3 34
Aug 1,018 315 (703) 10.2 56
Sep 883 292 (591) 9.7 188
Oct 511 433 (78) 14.0 446
All values in kWh (except HDD).
1 January values based on meter reads.
2 February values based on TED data.
3 Heating Degree Days, a measure of how many outside degrees in a day it is below a base target inside temperature, 68F.
4 Calculated from our HOBO outdoor weather monitor hourly data, unless otherwise noted.
5 January HDD data downloaded from degreedays.net, Station ID: KALB (Albany International Airport).
6 March values based on meter reads. (TED died March 1st, eMonitor installed March 16, 2012)
7 Values starting in April are based on eMonitor data.

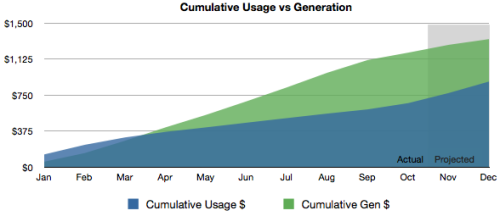
Cumulative usage vs production as of Oct 2012

I put this chart together for the Green Building Open House Tour. I wanted to show in dollars, how much power we’ve used and how much we’ve generated since we moved in at the beginning of the year. As of the end of October, we’ve used 4,434 kWh and generated 7,939 kWh. At roughly $0.15 per kWh that works out to $665 in electricity usage versus $1,191 for electricity produced. Of course we don’t get 15 cents a kWh when we sell it back to the grid, but it illustrates that we’re accumulating value faster than we’re spending it over the year.

You can see heat maps and detailed charts of temperature and electrical usage at netplusdesign.com. View solar, usage, net usage, temperatures and HDD for all of February and circuit-level data for 16 days in March and the full months of April through October.

September performance

performance chart september

Fall weather arrived last month. More rain and clouds with cooler nights. We generated 883 kWh in September, down 15% from last month, but still about 37 kWh better than predicted. We generated on average 29.4 kWh per day.

We used 292 kWh, our lowest month yet. That’s down 7% from the previous month. We used the air conditioning only 2 days and heating for 1 day. We used 9.5 kWh for cooling / dehumidification, and 5.9 kWh for heating. Together that’s 5% of our month’s total usage. We generated a 591 kWh surplus this month, our 7th surplus month in a row.

I changed the format of the table a bit. Months now run down the table instead of across.

Month Solar PV Usage Net usage or (surplus) Avg. daily usage HDD3,4
Jan1 369 873 504 28.2 1,2125
Feb2 597 666 69 23.0 1,045
Mar6 860 515 (345) 16.6 704
Apr7 925 378 (538) 12.9 617
May 867 309 (558) 10.0 298
Jun 939 325 (614) 10.8 144
Jul 970 319 (651) 10.3 34
Aug 1,018 315 (703) 10.2 56
Sep 883 292 (591) 9.7 188
All values in kWh (except HDD).
1 January values based on meter reads.
2 February values based on TED data.
3 Heating Degree Days, a measure of how many outside degrees in a day it is below a base target inside temperature, 68F.
4 Calculated from our HOBO outdoor weather monitor hourly data, unless otherwise noted.
5 January HDD data downloaded from degreedays.net, Station ID: KALB (Albany International Airport).
6 March values based on meter reads. (TED died March 1st, eMonitor installed March 16, 2012)
7 Values starting in April are based on eMonitor data.

Again I was surprised that our usage for the month was lower than last month. The big energy saver this month was less need for cooling and dehumidification. Most of the canning was finished last month. We added a freezer in the basement last month. So far it has not appeared to impact our daily usage by a noticeable amount.

The number of hours we experienced temperature values below 68F increased to 188 HDD, right on average for September in our area. Our water usage is also back down to a more normal non-summer range of 43.8 gallons per day.

You can see heat maps and detailed charts of temperature and electrical usage at netplusdesign.com. View solar, usage, net usage, temperatures and HDD for all of February and circuit-level data for 16 days in March and the full months of April through September.

August performance

We generated 1,018 kWh in August, up 5% from last month. That is our best month yet, and our best daily average of 32.8 kWh per day as compared to the last two month’s average of 31.3 kWh per day. Typically solar generation starts to decline in August, with decreasing sunlight hours, more clouds and more heat, but not this year.

We used 315 kWh, 1% less than the previous month. We used the air conditioning for only 3 days. We used 10 kWh for cooling / dehumidification, 3% of our month’s total usage. We generated a 703 kWh surplus this month, our 6th surplus month in a row and highest yet.

Jan1 Feb2 Mar6 Apr7 May Jun Jul Aug
Solar PV 369 597 860 925 867 939 970 1,018
Usage 873 666 515 378 309 325 319 315
Net usage or (surplus) 504 69 (345) (538) (558) (614) (651) (703)
Avg. daily usage 28.2 23.0 16.6 12.9 10.0 10.8 10.3 10.2
HDD3,4 1,2125 1,045 704 617 298 144 34 56
All values in kWh (except HDD).
1 January values based on meter reads.
2 February values based on TED data.
3 Heating Degree Days, a measure of how many outside degrees in a day it is below a base target inside temperature, 68F.
4 Calculated from our HOBO outdoor weather monitor hourly data, unless otherwise noted.
5 January HDD data downloaded from degreedays.net, Station ID: KALB (Albany International Airport).
6 March values based on meter reads. (TED died March 1st, eMonitor installed March 16, 2012)
7 Values starting in April are based on eMonitor data.

I was surprised that our usage for the month was lower than last month. We’ve been using the stove like crazy canning tomatoes, dehydrating veggies and making lots of pesto. The big energy saver this month was less need for cooling and dehumidification. The number of hours we experienced temperature values below 68F increased to 56 HDD, although this is still below the average of 90 HDD for August in our area. Our water usage is also back down to a more normal summer range of 79.5 gallons per day.

You can see heat maps and detailed charts of temperature and electrical usage at netplusdesign.com. View solar, usage, net usage, temperatures and HDD for all of February and circuit-level data for 16 days in March and the full months of April through August.

Our water usage

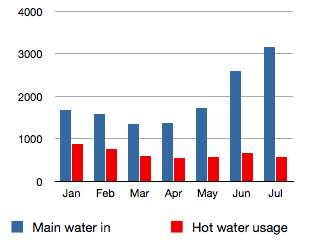
Water usage to date

In our July performance post I stated that we were tracking our water usage and water pump usage to calculate the efficiency of the pump. Dan Gibson asked in a comment about our water usage, so I thought I’d cover that here. He says in his comment that there are not a lot of actual hard numbers on water usage and he’s definitely right. Most estimates I’ve seen online say 50 to 100 gallons per person, which seems both excessive and vague at the same time.

We installed water meters on the main line and the inlet to the hot water tank. We have usage data starting in January when we moved in.

All values in gallons Jan Feb Mar Apr May Jun Jul
Main water inlet 1,677.3 1,584.2 1,338.3 1,373.4 1,722.4 2,593.1 3,166.9
per day 54.1 54.6 43.2 45.8 55.6 86.4 102.2
Hot water inlet 884.5 746.6 600.8 552.5 569.7 660.8 567.4
per day 28.5 25.7 19.4 18.4 18.4 22.0 18.3

A couple of notes on the data. Our shower wasn’t ready for use until the middle of February which increased out water usage in the first few months. Showers are obviously more efficient than tubs. In May, we acquired 3 dairy goats, some chickens, started building a barn and watering the garden, pushing up our usage again.

Taking these factors into account, it looks like our typical average indoor water usage is about 45-50 gallons per day for 2 adults, or 23-25 gallons per person. Our hot water usage seems to average about 20 gallons per day. Hot water accounts for roughly 40% of our total indoor usage.

The larger number in July indicates the unfortunate situation where we turned on the water to the garden and forgot to turn it off. It ran for a few hours. Thankfully we use soaker hoses, otherwise the loss could have been much larger.

We had planned to use cistern water for the garden, but we ended up moving the garden to a different location that is about the same elevation as the cistern, meaning we can’t use gravity feed. We’re working on a low tech solution to pump the cistern water up above the garden to a separate tank which can than use gravity feed. For now, it seems just as efficient to use well water.

If you have any questions, let us know in the comments.

July performance

Heat map of high temps in July

We generated 970 kWh in July, up 3% from last month. That is our best month yet, but in line with last month’s daily average of 31.3 kWh. We used 319 kWh, 5% less per day on average than last month. We turned on the air conditioning for 3 days during a particularly humid run, and periodically for a few days the next week. We used 12 kWh for cooling / dehumidification, 8% of our month’s total usage. We generated a 651 kWh surplus this month, our 5th surplus month in a row and highest yet.

Jan1 Feb2 Mar6 Apr7 May Jun Jul
Solar PV production 369 597 860 925 867 939 970
Usage 873 666 515 378 309 325 319
Net usage or (surplus) 504 69 (345) (538) (558) (614) (651)
Avg. daily usage 28.2 23.0 16.6 12.9 10.0 10.8 10.3
HDD3,4 1,2125 1,045 704 617 298 144 34
All values in kWh (except HDD).
1 January values based on meter reads.
2 February values based on TED data.
3 Heating Degree Days, a measure of how many outside degrees in a day it is below a base target inside temperature, 68F.
4 Calculated from our HOBO outdoor weather monitor hourly data, unless otherwise noted.
5 January HDD data downloaded from degreedays.net, Station ID: KALB (Albany International Airport).
6 March values based on meter reads. (TED died March 1st, eMonitor installed March 16, 2012)
7 Values starting in April are based on eMonitor data.

I also did some number crunching this month to start tracking the efficiency of our water pump over time. We track the water pump electrical usage and the number of gallons of cold and hot water we use each month. We’re currently using 2.6-2.7 watt hours per gallon of water pumped from the well. That’s roughly 374 gallons per kWh. I’m curious if that is a good number or not? I’ll have to do some research.

The image at the top of the post shows a heat map of the high temps of the month. The average temperature in July was 73.6F, up 7F from June. You can see heat maps and detailed charts of temperature and electrical usage at netplusdesign.com. View solar, usage, net usage, temperatures and HDD for all of February and circuit-level data for 16 days in March and the full months of April through July.

Rainwater catchment system completed

Last year when we had the foundation excavated, we bought a 1000 gallon cistern and buried it under the future porch. It was so long ago and so well hidden that I almost forgot about it. But a few months ago I realized that this would require a bit of research to put together a simple working system that looked like it was designed to integrate with the house rather than tacked on later.

Let’s take a look at the components of our planned rain water system.

1) The Tank. We have a 1,000 gallon Bruiser. It has an inlet at the top, an outlet near the bottom and an overflow just below the inlet.

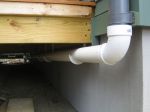
2) Gutters and downspouts. 6″ half round painted aluminum, connected to 4″ round downspouts. One on the front of the house, one on the back. There’s also a gutter on the porch but it will not drain into the cistern at this time.

3) Downspout filter. When I started thinking about how to connect the downspouts to the cistern I knew the hard part was to find a way to filter the leaves and other stuff (dead bugs and bird pooh) out, without bolting some large contraption to the side of the house. If you’ve spent any time looking around for downspout filters, there’s a lot of different solutions and products out there. Most are u-g-l-y.

The first product I found that was acceptable was the Downspout Filter from RainXchange. It appeared to do everything we needed. It’s buried so you don’t see any ugly attachments to the house, and it would filter the volume of water we expected from the roof.

However, I started thinking about how we’d actually route the downspouts to the filter. Because of the slope on the side of the house, I realized we really needed a filter that we could connect directly to the downspouts and have all connections underground. The filter from RainXchange was made to be buried under the downspout discharge. I’d need to find a way to route 2 downspouts to discharge above the filter. Or buy two and position one at each downspout, but because of the slope this wouldn’t work for the front gutter.

Shortly thereafter I found the Small Basket Filter from ConservationTechnology. They were recommended by my contractor. They unfortunately never came up on any web search for rain filters, but they had exactly what we needed. A simple filter, easily accessible from above and all connections buried. There is one inlet and an overflow at the same level. The outlet from the filter is at the bottom which connects to the cistern. The overflow is plumbed to daylight, downslope and away from the house. The lid top is adjustable in height making the depth of the filter variable. See SketchUp model view above for underground connections.

4) Connections. We originally planned to use aluminum downspout components to connect to the filter, but standard aluminum components are fairly restricted. 75 degree angles are the norm, anything else is custom. So we decided to connect the downspouts to the filter using standard PVC pipes and fittings. It won’t be pretty, but neither would the aluminum. The porch will hide most of it, and I’m confident we can find some other creative ways to hide the ugly stuff.

5) Plumbing. The cistern is plumbed to the basement so that if needed, we could add a pump. Then routed to the exterior. We’re not using frost-free sillcocks. They rely on the excess heat inside the envelope to warm the pipe, but because we have 12 inches of insulation, they would just freeze and leak into the wall. So we’re installing valves with a blowout hole so we can easily drain the pipes each winter.

Now we have a simple source of water for our future garden without pumps or the use of electricity.

Plumbing stuff and water usage

Our plumber came out last week to set the bathtub and install the tub faucets. He also connected the drains for our tub and shower. Meanwhile, Warren has been working on the home run manifolds for hot and cold water.

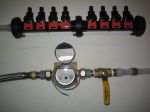
Part of the plumbing setup in the basement involves the installation of two DLJ single jet water meters. We get our water from a well, and homes that use wells don’t typically monitor water usage since they are not paying for water from a public supply. But I wanted to be able to track our total water usage and hot water usage separately. That’s why we have two meters.

The first meter is positioned after the pressure tank before the cold water manifold. This measures the total water consumption. The second is positioned at the hot water tank intake (cold water meters can’t be used for hot water). This will measure the total number of gallons that goes into the hot water tank to be heated.

These meters are very compact and we’re using the ones that enable remote data collection which I hope to setup in the future. Thanks to Erik at Erik’s Blog for the tip on the DLJ water meters. See his post, Got Monitoring? for more references to monitoring equipment.

September Updates

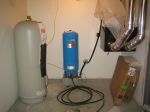
Lot’s going on this month. If you follow us on twitter (@uphillhouse) you’ll know that we now have running water! Gould & Sons came out to install the pump and water pressure tank. They drilled the well a little over a year ago in June. See the post, Drill baby, drill!. They set the pump at 300′ which should give us 12-15 gallons per minute.

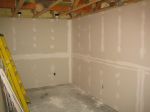
Last week also saw the installation of sheetrock on the 2nd floor and basement. Taping should be completed by the end of the week in those two areas so we can start priming and painting. As soon as we get the basement primed, we can move all the tools from the first floor to the basement. Then we can finish insulating and sheetrocking the first floor.

This weekend I was able to install the shower pan mortar base and drain. We’ll be using Kerdi-Drain and Kerdi membrane, a waterproofing material from Schluter, to water seal the shower enclosure. I’m hoping to get started with the membrane this week.

We also received several deliveries last week. Our water heater arrived. It’s a 50 gallon Marathon. It’s a very efficient electric water heater and well insulated. We decided not to go with the Hybrid heat pump approach, which is a great idea but not for our cold climate and dry basement. We decided against tankless hot water approaches because we’re all electric. I haven’t done a huge amount of research but it looks like the electric tankless approach is getting better over time. This may be a good approach in the future.

And our gutters finally arrived. Warren started putting up the front side gutters today. I’m working on a post about how we’re connecting the downspouts to the rain filter and cistern under the porch. It has taken quite a bit of research to figure it all out.

Tomorrow the tub surround will be installed. And hopefully the rain will hold off long enough tomorrow to finish installing the gutters and downspouts.

We’re trying to finish as much as we can for the Green Building Open House / National Solar Tour this Saturday. Many thanks to Paul and Joanne Coons from Clifton Parks for stopping by last weekend and dropping off the open house sign. You can find their house and lots of other amazing houses on the tour at the NESEA Green Buildings or the National Solar Tour sites. Stop by to visit.

July updates

It’s hard to imagine that it’s already August!

We’ve been busy with porch framing, painting the siding, sealing the deck, insulating water pipes and framing the last interior wall for the ASHP.

We still have a long way to go with the siding, but we’re getting a jump on the second coat of stain on the weekends. The Cabot acrylic stain really goes on well and the color (Thicket) looks great.

Warren and crew have completed the porch framing and deck, and about about a third of the ceiling v-groove. We sealed the edges of the porch deck this weekend. Bernie thinks we built the porch just for her. (The sealer is really to protect the deck from her drool.)

We’ve finished insulating most of the plumbing pipes in the 2nd floor. There is one area where the pipes are too close together to use individual foam wraps, so we’re going to try spray foam.

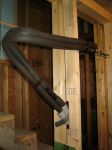
And finally the last interior wall. The refrigerant copper tubing for the interior unit of the ASHP can’t be bent in a tight radius, so we built a double stud wall at the stair to allow the tubing to bend more graciously. There is only a gap of an inch between the two walls. The tubing goes diagonally down to the lower right corner then through the first landing and out the exterior wall. The condensate drain also goes through this double wall. It passes through the second landing into the pantry to drain in the washer / dryer drain.

August promises to be even busier.

Bath Time

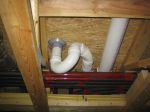
Last week the plumber roughed in the waste pipes and venting. Soon he’ll begin the hot and cold water supply lines. He asked what faucets we’re using to make sure he has all the right connections, specs, etc. This prompted a mini bath shopping spree, and an opportunity for me to share our bath plans.

Faucets: We really like the old-fashioned cross handles, and starting looking around for an updated, streamline version. We eventually settled on the Grohe Arden line as they are less expensive than similar models from Kohler and Berclay and got great reviews. We ordered the Watersense versions (low-flow 1.5 GPM) in chrome last Friday. Unfortunately it will take 2 weeks for delivery.

Bathtub: We are doing a separate soaking tub and shower. We bought the 6′ Kohler Archer drop-in tub before we closed in the house. Larry started working on the the framing for the tub surround over Memorial Day weekend, and I put a deposit on a Carrara marble slab for the tub surround yesterday.  Once the framing is done, we will make a trip to the stone yard to pick out our slab and the installers will come to the site and create a template. It will take about two weeks to cut, edge and polish the slab after templating. The tub drain was ordered with the faucets, so all the plumbing should be in place before the slab is ready for install.

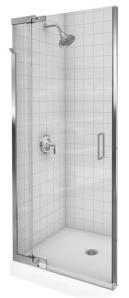
Shower: We are looking into using the Schluter-Shower System to waterproof the shower area. It’s cool because you install it over regular drywall and it keeps everything water tight. We will be using a frameless glass door instead of a curtain to allow more light and help make the space feel bigger.

Tile: We were originally planning to tile the walls in the bath, but to save money we are now just tiling the shower enclosure and front of the tub surround. We are considering Lucian glass tiles from Ann Sacks and Optix from Waterworks. We have chosen a light gray porcelain tile for the floor and are looking at a flat pebble for the shower floor in either a blue/green mix or white (similar to Carrara.)

Vanity: Next big sale day, we will be ordering the Hutton washstand in dark espresso with Carrara marble top from Restoration Hardware.

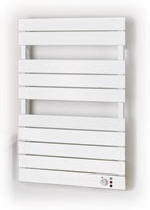
Heat: We will be heating the bathroom (and our towels) with a Runtal Radiator Electric Omnipanel.


Enter your email address to subscribe to this blog and receive notifications of new posts by email.

Join 305 other subscribers