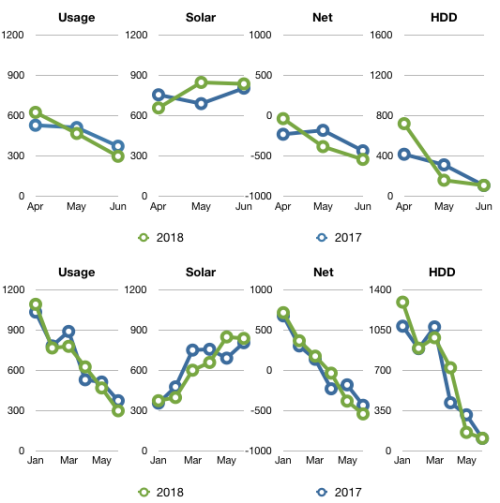
Q2 2018 summary: 18% colder, 2% less usage and 4% more sun as compared to Q2 2017.
This is part of our quarterly home performance reporting. All data is posted at netplusdesign.com
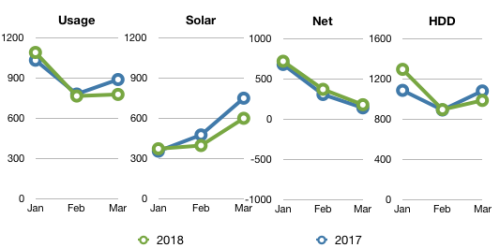
Overall, here’s how this quarter compared to 2017.
| 2017 | Usage | Solar PV | Net usage or (surplus) |
Avg. daily usage |
HDD |
| Total | 1,421 | 2,258 | (837) | 15.6 | 847 |
| Apr | 531 | 758 | (227) | 17.7 | 421 |
| May | 514 | 692 | (178) | 16.6 | 315 |
| Jun | 375 | 807 | (432) | 12.5 | 110 |
| 2018 | Usage | Solar PV | Net usage or (surplus) |
Avg. daily usage |
HDD |
| Total | 1,396 | 2,349 | (953) | 15.3 | 997 |
| Apr | 627 | 660 | (32) | 20.9 | 724 |
| May | 470 | 850 | (381) | 15.2 | 162 |
| Jun | 300 | 839 | (540) | 10.0 | 111 |
Quite a bit cooler this quarter. The last day we used heat was May 1. That’s about 2 or 3 weeks later than usual.
Here’s our breakdown on energy use and cost for the last six winter seasons.
| Winter season | Heat kWh | Est. Cost |
| 2012-13 | 957 | $144 |
| 2013-14 | 1,804 | $271 |
| 2014-15 | 2,200 | $330 |
| 2015-16 | 1,305 | $196 |
| 2016-17 | 1,804 | $271 |
| 2017-18 | 2,103 | $315 |
We would have spent about $1,527 (if we paid for electricity) for the last six winters.
We haven’t netted out energy-wise yet. We’re still 312 kWh short. In 2016 we netted out on May 31 after 8am. In 2015 we were 637 kWh short. In 2014 we netted out around mid-July. In years prior we were net positive by May or June.
Our overall water usage is down 6% from Q2 2017. It started out dry this quarter but the rain picked up. We only had to water the garden a few times. Out hot water usage was down 22%.
You can see heat maps and detailed charts of temperature and electrical usage at netplusdesign.com. View hourly, daily and monthly values for solar, usage, net usage, circuit-level usage, temperatures and HDD.

