Archive for the 'Performance' Category


Third quarter 2016 performance

Q3 2016 summary: 10% cooler, 3% less usage and about the same amount of sun as compared to Q3 2015.

This is part of our quarterly home performance reporting. All data is posted at netplusdesign.com

Nothing exciting to report, which is normal for 3rd quarters.

At 7am on May 31st we became net positive for the year. As of the end of September, we have a surplus of 1,900 kWh heading into the final months of 2016.

Overall, here’s how this quarter compared to 2015.
Chart showing usage, solar, net and hdd

2015 Usage Solar PV Net usage
or (surplus)
Avg.
daily usage
HDD
Total 991 2,866 (1,875) 10.8 175
Jul 342 949 (607) 11.0 39
Aug 332 1003 (671) 10.7 34
Sep 317 914 (597) 10.6 102
2016 Usage Solar PV Net usage
or (surplus)
Avg.
daily usage
HDD
Total 958 2,857 (1,900) 10.4 192
Jul 300 955 (655) 9.7 32
Aug 330 934 (604) 10.6 27
Sep 328 968 (641) 10.9 133
All values in kWh (except HDD which is base 65°F).

Water usage was up 22%. Water for the garden plus we installed a water softener and flushed the hot water tank this summer.

You can see heat maps and detailed charts of temperature and electrical usage at netplusdesign.com. View hourly, daily and monthly values for solar, usage, net usage, circuit-level usage, temperatures and HDD.

Second quarter 2016 performance

Q2 2016 summary: 23% cooler, 8% less usage and 11kWh more sun as compared to Q2 2015.

This is part of our quarterly home performance reporting. All data is posted at netplusdesign.com

Overall, here’s how this quarter compared to 2015.

Chart showing usage, solar, net and hdd

2015 Usage Solar PV Net usage
or (surplus)
Avg.
daily usage
HDD
Total 1,568 2,658 (1,090) 17.3 810
Apr 594 796 (202) 19.8 566
May 417 998 (581) 13.4 145
Jun 557 864 (307) 18.6 100
2016 Usage Solar PV Net usage
or (surplus)
Avg.
daily usage
HDD
Total 1,439 2,669 (1,230) 15.8 994
Apr 575 893 (318) 19.2 615
May 551 834 (283) 17.8 279
Jun 313 942 (629) 10.4 100
All values in kWh (except HDD which is base 65°F).

The last day we used heat was April 17 for a total of 120.4 kWh this quarter. Last year we turned the heat off on April 28th and used 150.3 kWh that quarter.

Here’s our breakdown on energy use and cost for the last four winter seasons.

Winter season Heat kWh Est. Cost
2012-13 957 $144
2013-14 1,804 $271
2014-15 2,200 $330
2015-16 1,305 $176
Est. cost based on $0.15 kWh.

We would have spent about $921 (if we paid for electricity) in the last four winters. That’s still a lot less than many of our neighbors would spend in one winter.

We netted out energy-wise on May 31 after 8am. Last year we were 637 kWh short of netting out for the year. In 2014 we netted out around mid-July. In years prior we were net positive by May or June.

Our water usage is up 66% from Q2 2015. June was very dry this year and we were determined not to let the garden die. Our reward is lots of tomatoes and other veggies.

You can see heat maps and detailed charts of temperature and electrical usage at netplusdesign.com. View hourly, daily and monthly values for solar, usage, net usage, circuit-level usage, temperatures and HDD.

First quarter 2016 performance

Q1 2016 summary: 26% warmer, 21% less usage and 33% more sun as compared to Q1 2015.

This is part of our quarterly home performance reporting. All data is posted at netplusdesign.com

Although it seemed a lot warmer this winter, 1,023 less heating degree days than Q1 2015, it was still 9% cooler than first quarter 2012 which is the warmest winter since we began recording temperature data.

Despite it being warmer this winter, we recorded a low of -17.3°F, 1.2 degrees colder than last year’s low. Our high was 78.5°F which was considerably warmer than last year’s high of 52.8, but lower than 2012 when we recorded a high of 82.4°F.

Overall, here’s how this quarter compared to 2015.

Chart showing usage, solar, net and hdd for Q1 2016

2015 Usage Solar PV Net usage
or (surplus)
Avg.
daily usage
HDD
Total 3,214 1,488 1,726 35.7 3,975
Jan 1,163 400 763 37.5 1,419
Feb 1,096 300 796 35.4 1,449
Mar 955 788 167 30.8 1,107
2016 Usage Solar PV Net usage
or (surplus)
Avg.
daily usage
HDD
Total 2,550 1,982 568 28.0 2,952
Jan 1,055 499 556 34.0 1,192
Feb 846 586 260 29.2 1,009
Mar
649 897 (248) 20.9 751
All values in kWh (except HDD which is base 65°F).

Our heat pump used 1,529 kWh last year and 955 kWh this year. We’re getting a fairly consistent correlation between energy use and heating degree days using a base temperature of 65°F. ASHP regression analysis correlating HDD to kWh

The lower energy use was directly correlated to warmer temperatures. Plus there was less snow to hide the solar panels and it was less cloudy, so we generated more energy too.

The grass was just starting to green up. We had a few plants budding out and a few trees looked like they were ready to pop. We even had two new baby goats born last week. Then we got about 4 inches of snow Monday. Thankfully it’s mostly gone after temps in the upper 30’s and lots of sun today. We’re ready for Spring!

You can see heat maps and detailed charts of temperature and electrical usage at netplusdesign.com. View hourly, daily and monthly values for solar, usage, net usage, circuit-level usage, temperatures and HDD.

We’re net positive again in 2015!

We used 7,141 kWh and generated 8,694 kWh for a net of 1,552 kWh for the year. This is our second highest net energy year after 2012. Here’s our progress for the first 4 years in the house.

Usage Solar PV Net usage
or (surplus)
Avg.
daily usage
HDD
Total 28,056 34,473 (6,417) 19.1 26,530
2012 5,601 8,856 (3,256) 15.3 5,885
2013 7,206 8,575 (1,368) 19.7 6,810
2014 8,108 8,348 (240) 22.2 7,063
2015 7,141 8,694 (1,552) 19.6 6,772
All values in kWh (except HDD which is base 65°F).

Q4 2015 summary: 18% warmer, 24% less usage and 42% more sun as compared to Q4 2014.

In Q4 our total usage was 1,802 kWh, an 8% decrease from our 1,957 kWh in 2014. We also generated 497 kWh more this quarter than last.

Overall, here’s how this quarter and the year compare to 2014.

Charts comparing Q4 and YOY usage, solar and HDD

2015 Usage Solar PV Net usage
or (surplus)
Avg.
daily usage
HDD
Total 1,367 1,683 (315) 14.9 1,810
Oct
377 710 (192) 12.2 488
Nov
399 648 (81) 13.3 597
Dec
591 325 653 19.1 725
2014 Usage Solar PV Net usage
or (surplus)
Avg.
daily usage
HDD
Total 1,802 1,186 616 19.6 2,213
Oct
413 538 (125) 13.3 373
Nov
570 400 170 19.0 807
Dec
819 248 571 26.7 1,033
All values in kWh (except HDD which is base 65°F).

Year-over-year comparison

Year over year usage comparison

Our biggest energy months continue to be in Spring when we’re hatching and brooding chickens and turkeys. This is our second year to raise a year’s worth of chicken and turkeys. It is worth noting that I’ve been spending a lot more time outside the home office and the energy usage reflects this. Running a few computers, radio, etc every day adds up over a year. I think it’s interesting which months are very close (January-February), fairly close (October-November) and very divergent (April-June). 
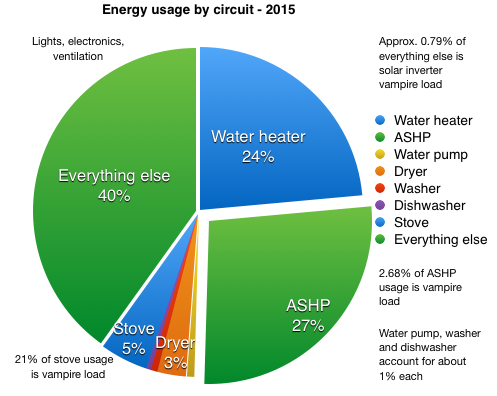
Pie chart - circuit breakdown

There’s not a lot of notable changes in usage by circuit (above). 2015 was both colder and hotter than prior years (see temperature ranges below). Because of the increased cold, the ASHP and water heater used a larger percentage of the total. Vampire loads increased this year because I forgot to flip the circuit breaker for the ASHP during the summer. The induction cooktop & stove and solar inverter both used about the same vampire loads as last year. In total these 3 appliances used 145 kWh in 2015 to do no useful work for us except be ready to leap into action at a moment’s notice. 

Net zero moment

Our ‘net zero moment’ this year occured in early July. This was earlier than last year but much later than 2013. Our solar curve remains fairly constant. Our usage changes the most from year to year, manly due to weather.
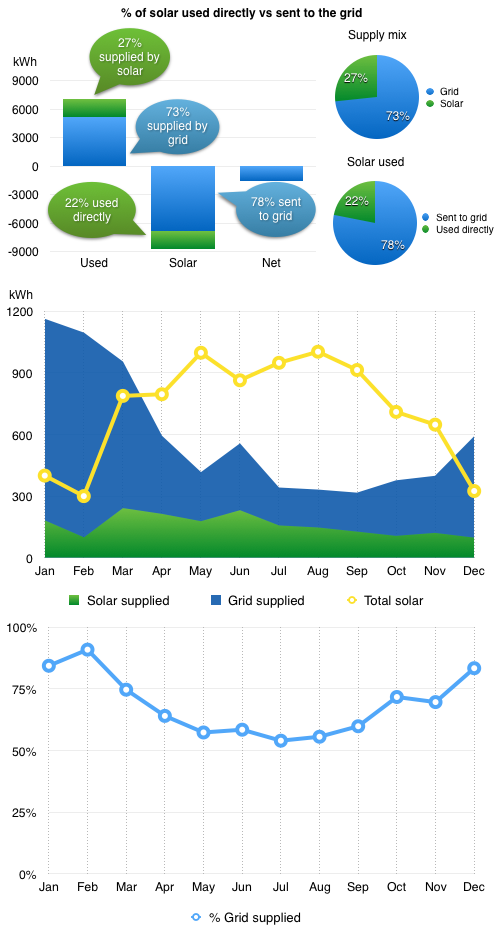
Charts showing mix of solar and grid supplied elect.

All that solar is awesome, but I’d really like to use more of it. Currently we only use 22% of the solar power we generate directly. The other 78% goes back to the grid so other people use it. That 22% represents 27% of our energy mix. 73% of the electricity we use is from the grid.

There are two ways to use more of our solar. 1) Only use power when the sun is shining. 2) Use a battery. Something like the Tesla PowerWall would do nicely.
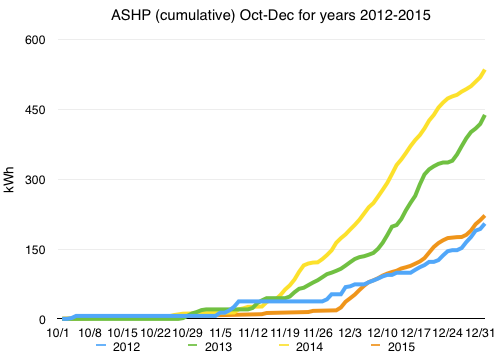
Chart of ASHP usage values Oct-Dec, 2012-2015

This was the warmest fourth quarter since we moved into the house. As a result, we used a lot less heating energy than the last two years. Every year I try a slightly different strategy with the thermostat. This year I programmed it at 65 during weekdays from 8am-4pm and 9pm-4am, and 68 at all other times. We generally get enough sun during the day that the daytime setback is not really noticeable. If we see a cold snap coming up I’ll reset it to stay at 68. I’m also trying to be more diligent and clean the filters every month. I think this may have played a part in our prior years increased usage, adjusted for weather.
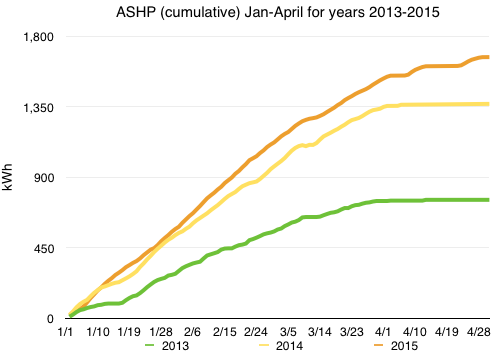
Chart of ASHP usage values Jan-Apr, 2013-2015

I also added a plot (above) of our heat energy usage in the January through April timeframe. It’s interesting because 2015 was colder than 2014 (4,541 vs. 4,274 HDD) but the heat energy was not that much greater (1366 kWh in 2014 vs. 1,665 kWh in 2015).
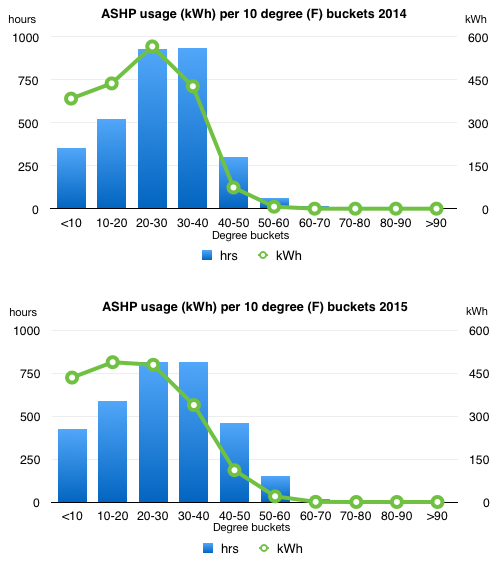
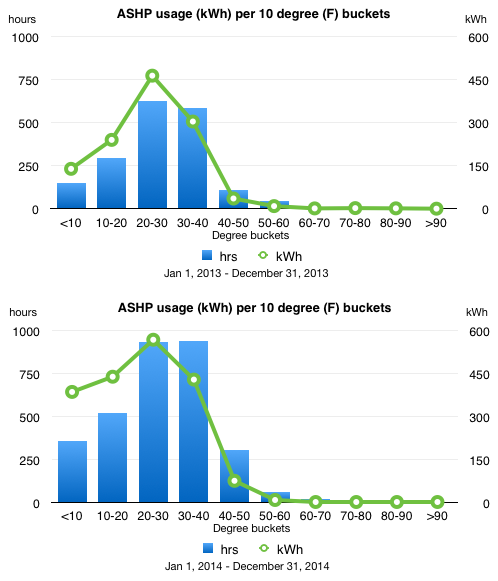
Chart showing kWh used by ASHP in 10 degree bucketsThe plot above shows the amount of hours and energy we used for each 10 degree drop in temperature. 2014 had a larger number of hours in the 20-30 and 30-40 degree buckets. 2015 had less in these areas and more in the lower temperature bands. Most of the ASHP usage has consistently occurred in the 20-40 degree range.
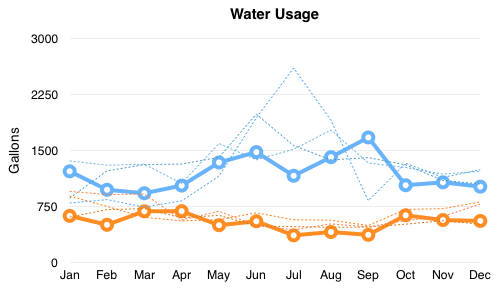
Chart comparing water usage 2012-2015

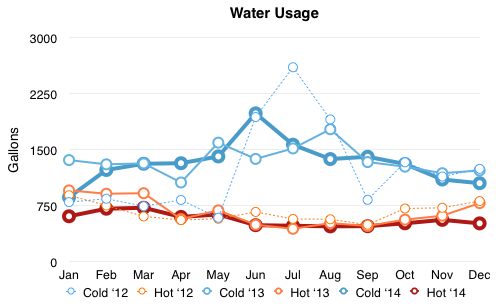
We seem to be fairly consistent in our hot water usage. Over the year we averaged 17.5 gallons/day, down from 18.4 last year. That hot water requires 263 watts/gallon to heat. We used 39.1 gallons of cold water per day, down from 43.5 last year. The difference is almost completely attributable to how much we water the garden. We used a total of 20,684 gallons of water in 2015, down from 22,575 last year. It took 52 kWh to pump that water out of the ground. 
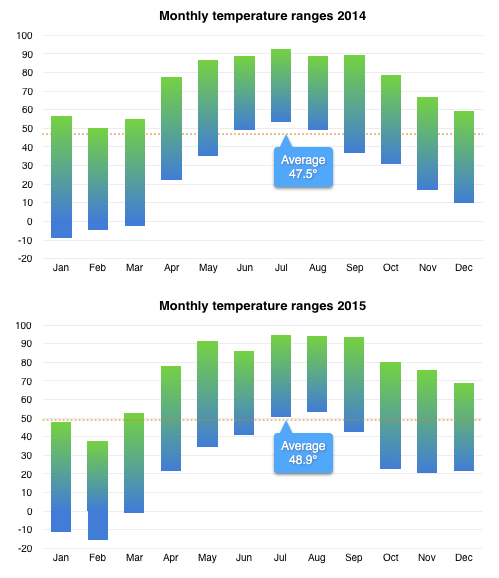
Chart comparing temperature ranges 2014-2015

We experienced our largest temperature range this year out of the last 4 years, 110.721°. Our coldest temperature was -16.112° on February 16 at 7am. Our high was 94.609° on July 29 at 3pm. Our highest recorded temperature in the last four years was 95.135°, set on July 19, 2013 at 3pm.

The average temperature for 2013 was 48.5°. 2014 was 47.5° and 2015 was 48.9°. I’m missing January temperature data for 2012. At the end of this January I will be able to calculate the average for the last 4 years of our collected data.

Happy 2016!

You can see heat maps and detailed charts of temperature and electrical usage at netplusdesign.com. View hourly, daily and monthly values for solar, usage, net usage, temperatures and HDD.

Third quarter 2015 performance

Q3 2015 summary: 38% warmer, 22% less usage and 3% more sun as compared to Q3 2014.

This is part of our quarterly home performance reporting. All data is posted at netplusdesign.com

Traditionally, 3rd quarters are pretty boring in the home performance category. No heating. Generally no air conditioning. No ventilator because the windows are open. At this time of year, the main job of the house is to keep the rain out, and we didn’t get much of that this quarter.

Our most exciting finding this quarter was that we had a 1+ megawatt month. In August we produced 1.003 MW. This is only the second time we’ve produced more than a megawatt in a single month. The first was August 2012 when we produced 1.018 MW.

Sometime in early August we became net positive for the year. We now have a surplus of 1,239 kWh heading into the final months of 2015.

Overall, here’s how this quarter compared to 2014.

Charts comparing Q3 usage, solar and HDD

2014 Usage Solar PV Net usage
or (surplus)
Avg.
daily usage
HDD
Total 1,263 2,780 (1,517) 13.7 280
Jul 432 950 (518) 13.9 37
Aug 440 919 (479) 14.2 64
Sep 391 911 (520) 13.0 179
2015 Usage Solar PV Net usage
or (surplus)
Avg.
daily usage
HDD
Total 991 2,866 (1,874) 10.8 175
Jul 342 949 (607) 11.0 39
Aug 332 1,003 (671) 10.7 34
Sep 317 914 (596) 10.6 102
All values in kWh (except HDD which is base 65°F).


You can see heat maps and detailed charts of temperature and electrical usage at netplusdesign.com. View hourly, daily and monthly values for solar, usage, net usage, circuit-level usage, temperatures and HDD.

Second quarter 2015 performance

Q2 2015 summary: 4% cooler, 17% less usage and 2kWh more sun as compared to Q2 2014.

This is part of our quarterly home performance reporting. All data is posted at netplusdesign.com

It is a wet, foggy and cold July 4th at Up Hill House. Perfect weather to update our quarterly numbers! And like today, this quarter was fairly uneventful. In energy terms, however, that is not a bad thing for us.

Overall, here’s how this quarter compared to 2014.

Charts comparing Q2 usage, solar and HDD

2014 Usage Solar PV Net usage
or (surplus)
Avg.
daily usage
HDD
Total 1,886 2,656 (770) 20.1 845
Apr 751 889 (138) 25.0 550
May 662 834 (171) 21.4 231
Jun 413 869 (456) 13.8 64
2015 Usage Solar PV Net usage
or (surplus)
Avg.
daily usage
HDD
Total 1,568 2,658 (1,090) 17.3 810
Apr 594 796 (202) 19.8 566
May 417 998 (581) 13.4 145
Jun 557 864 (307) 18.6 100
All values in kWh (except HDD which is base 65°F).

The last day we used heat was April 28 for a total of 151kWh this quarter. Last year we turned the heat off on April 5th and used 33 kWh that quarter.

We used a total of 2,200 kWh for heat for the winter of 2014-2015. At $0.15/kWh that’s $330. Last winter (13-14) we used 1,804 kWh or about $271. In the winter of 12-13, we used 957 kWh or $144.

We’re 637 kWh short of netting out for the year. Last year we netted out around mid-July. In years prior we were net positive by May or June.

Our water usage is down 13% from Q2 2014. I believe this is due to the short burst of summer-like weather in May and June. The warmer temps persuaded us to plant the garden a week earlier than usual, but then we lost most of the seedlings from the heat and lack of rain. We had to replant later in June.  So while our region was suffering from unseasonably warm temperatures and a lack of rain, we had no garden to water.

Happy July 4th!

You can see heat maps and detailed charts of temperature and electrical usage at netplusdesign.com. View hourly, daily and monthly values for solar, usage, net usage, circuit-level usage, temperatures and HDD.

First quarter 2015 performance

Q1 2015 summary: 7% cooler, 2% more usage and 14% less sun as compared to Q1 2014.

This is part of our quarterly home performance reporting. All data is posted at netplusdesign.com

Although it seemed a lot colder this winter, it was really only 7% cooler than first quarter 2014. And considering there were many nights much colder than last year, -16°F versus -8°F last year, we only used 2% more energy. The biggest difference was snow cover, specifically the snow that covered our solar panels. This resulted in 14% less energy generated this quarter compared to last year, which means we netted out using 21% more energy from the power company.

Overall, here’s how this quarter compared to 2014.

Chart showing usage, solar, net and hdd for Q1 2015

2014 Usage Solar PV Net usage
or (surplus)
Avg.
daily usage
HDD
Total 3,157 1,726 1,431 35.1 3,724
Jan 1,103 472 631 35.6 1,380
Feb 994 511 483 35.5 1,174
Mar
1,060 743 317 34.2 1,170
2015 Usage Solar PV Net usage
or (surplus)
Avg.
daily usage
HDD
Total 3,214 1,488 1,726 35.7 3,975
Jan 1,163 400 763 37.5 1,419
Feb 1,096 300 796 35.4 1,449
Mar 955 788 167 30.8 1,107
All values in kWh (except HDD which is base 65°F).

We also used the heat pump a bit different this year. In prior years I set the heat lower at night. But with many nights in the single digits this year, I just left the thermostat set at 68°F for the last three months. The result was a 13% increase in usage compared to Q1 2014. In total, the ASHP used 1,528 kWh in Q1, a price of $230. Still not too bad considering what most folks payed to heat their homes in our area the last 3 months.

If we subtract heating from total usage for the quarter, our usage was actually down 124 kWh this quarter. So the main difference in usage this year was heating energy. Usually we’ve turned the heat off by this time of year, but Winter has refused to release it’s icy grip on the region.

Our water usage is down 6% from Q3 2012. The water line to the barn froze in mid-February, so we’ve been carrying buckets of water down from the house. I’m sure that has had an affect on our water usage.

We’re looking forward to Spring!

You can see heat maps and detailed charts of temperature and electrical usage at netplusdesign.com. View hourly, daily and monthly values for solar, usage, net usage, circuit-level usage, temperatures and HDD.

We’re net positive again in 2014!

We used 8,108 kWh and generated 8,348 kWh for a net of 240 kWh for the year. The combination of cold temperatures, less sun and the plug-in Prius brought us close to our net point. Here’s our progress for our first 3 years in the house.

Usage Solar PV Net usage
or (surplus)
Avg.
daily usage
HDD
Total 20,914 25,779 (4,864) 19.1 19,758
2012 5,601 8,856 (3,256) 15.3 5,885
2013 7,206 8,575 (1,368) 19.7 6,810
2014 8,101 8,348 (240) 22.2 7,063

Q4 2014 summary: 7% warmer, 8% less usage and 25% less sun as compared to Q4 2013.

In Q4 last year our total usage was 1,957 kWh. This year is was 1,802 kWh, a 8% decrease. Snow covering the collectors for 8 days and cloudy weather resulted in 24% less energy production in Q4.

Overall, here’s how this quarter and the year compare to 2013.

Charts comparing Q4 usage, solar and HDD

2014 Usage Solar PV Net usage
or (surplus)
Avg.
daily usage
HDD
Total 1,802 1,186 616 19.6 2,213
Oct
413 538 (125) 13.3 373
Nov
570 400 170 19.0 807
Dec
819 248 571 26.7 1,033
2013 Usage Solar PV Net usage
or (surplus)
Avg.
daily usage
HDD
Total 1,957 1,576 380 21.3 2,372
Oct
482 674 (192) 15.6 405
Nov
559 639 (81) 18.6 838
Dec
916 263 653 29.5 1,129
All values in kWh (except HDD which is base 65°F).

Year over year comparison

Chart comparing year over year usage

I like to compare the energy we use each year excluding heat. Our little story chart above, shows our usage and how it has played out over the last 3 years. By far our biggest energy increases have been related to hatching and brooding chickens and turkeys each spring. We managed to raise a year+ worth of chicken and turkeys this year, not to mention all the milk and cheese from the goats. It would of course be cheaper to buy chicken, eggs, milk and cheese, and Thanksgiving turkey at the store, but we like to do things the hard way.

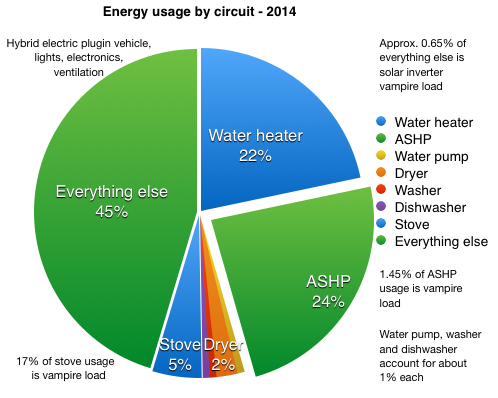
Pie chart - circuit breakdown

We started monitoring an additional 11 circuits in March when we switched to eGuage, but I haven’t had a chance to look at that data in any detail yet. The main changes this year, are increased usage of the ASHP and the ‘everything else’ category which included the Prius plugin for eight and a half months. I’ve also started tracking the vampire loads from things like the induction cooktop & stove, solar inverter and the ASHP. These are things you can’t just unplug. In total these 3 appliances used a minimum of 119 kWh to do nothing. I say minimum because I have only been able to start tracking some of these vampire loads with our new energy monitor starting in March.

Chart showing net zero break even point

This year I started plotting when we net out on energy use versus production. I call it the ‘net zero moment’. This year it happened about 2 months later than last year. Thankfully we didn’t cross over again in December.

Chart showing cumulative kWh used by ASHP Oct-Dec 2012-2014

Last year I noticed that our air-source heat pump (ASHP) used a lot more energy (114% more) in 2013 than in 2012. 2013 was cooler than 2012 but it was also sunnier. I never figured out the increase. This year, the ASHP also used more energy than last year despite being 7% warmer. Both the lack of sun (25% less) and our change in use of the thermostat most likely had the biggest impact. In 2013 I turned the heat off at night. This was generally fine until we had a few days below zero and the heat pump was not able to make up the difference. So this year I tried leaving the unit on and just turning it down to 65F at night. I think this has increased our usage without any real gain in comfort. It seems like it’s really only important to keep the unit on if the next day’s temperatures are known to be below zero, which is where our ASHP has trouble keeping up with demand.

Chart showing kWh used by ASHP in 10 degree buckets

Speaking of ASHP usage, here is our plot showing the amount of energy we used for each 10 degree drop in temperature. If you remember the post from last year, 2013 looks a little different. I realized the ASHP vampire load was throwing off my count of hours. This year I only show hours where the unit was actually doing something, heating or cooling the house. We had substantially more hours below 50 degrees. Most of the ASHP usage has consistently occurred in the 20-30 degree range.

Chart comparing water usage 2012-2014

We seem to be fairly consistent in our hot water usage. Over the year we’re averaging 18.4 gallons/day. That hot water requires 262 watts/gallon to heat. Cold water usage averages at 43.5 gallons/day. In total we used 22,575 gallons on water in 2014. It took 58 kWh to pump that water out of the ground. I’m guessing half of that is water for the various assortment of critters on the farm. They don’t drink a lot, but they do waste a lot.

Chart comparing temperature ranges 2013-2014

And lastly, just because I like this chart, the temperature ranges we experienced this year. In case it is not clear, 2014 was 0.9154149°F warmer on average than 2013.

Happy 2015!

You can see heat maps and detailed charts of temperature and electrical usage at netplusdesign.com. View hourly, daily and monthly values for solar, usage, net usage, temperatures and HDD.

Detailed data finally available again

We changed energy monitors in March and the new data format broke my database scripts, but I finally found time to update my scripts and publish* our hourly data for the period March to November. One thing I noticed immediately was that I had been sloppy in my reporting of energy use for that time period. I used the UI to select dates and didn’t realize I wasn’t getting the most accurate timeframe. As a result, I’m going to post an updated energy record at the end of January for the entire year.

Good news, we’re still on track to produce more energy than we used for 2014, but it is going to be a squeaker. At the end of November we had a revised 829 kWh in the bank. As of today, December 19, at 11:31 am Eastern time, we had used 495 kWh and generated 115 kWh for a net usage of 380 kWh. We have roughly 12 and a half days left and 449 kWh left in the bank.

The solar panels have been covered in snow 8 days day this month and our average usage is 26.7 kWh/day. So even if we had no sun the rest of the month and continued our average usage, we’d use 347 kWh leaving us with just 102 kWh to spare. Thankfully, we’ll get a little sunlight on the panels and the forecast is warmer next week. Fingers crossed.

* Detailed data available at NetPlusDesign.

3rd quarter 2014

Since we’re coming up on the solar tour this weekend, I wanted to post the numbers for July through September.

We turned net positive in August and now have a surplus of 851 kWh. Last year at this time we had a surplus of 1,749 kWh. Looks like we’re in fairly good shape to generate more than we use this year, unless we have more cold snaps. We’ve already had our first frost in September. Last year we turned the heat on October 27. Can’t wait to see what the next quarter holds for us.

Happy October and go see some homes on the solar tour this weekend!

2014 Usage Solar PV Net usage
or (surplus)
Avg.
daily usage
HDD
Total 6,246 6,997 (851) 22.9 TBD
Jan
1103 472 631 35.6 1,380
Feb
994 511 483 35.5 1,174
Mar1 1060 743 317 34.2 1,170
Apr 751 889 (138) 25.0 550
May 662 834 (171) 21.4 231
Jun 413 869 (456) 13.8 64
Jul 432 950 (518) 13.9 X
Aug 440 919 (479) 14.2 x
Sep 391 911 (520) 13.0 x

1 Transition from eMonitor to eGauge data begins March 8. Missing data for about 4 hours.


Enter your email address to subscribe to this blog and receive notifications of new posts by email.

Join 305 other subscribers